Survey Status Report Improvement
Survey Status Report Improvement
Overview
The Survey Status Report shows surveys are being shared and answered in an organization. It helps teams keep track of which surveys are still waiting for responses and which ones are already finished. This is especially useful in big organizations where many surveys are sent out to different departments at the same time.
We need this report because it helps everyone stay organized. Without it, some surveys might be forgotten or delayed, and we might miss important information. The report makes it easy to see which departments have completed their surveys, and which ones still need to respond. This helps managers follow up and make sure everything is on track.
This report also helps make sure the data we collect is complete and correct. When surveys are answered on time, the information is more useful and reliable. If some departments are slow to respond, the report shows that clearly, so support can be given if needed.
In the long run, the Survey Status Report helps the organization plan better. By looking at how different teams respond to surveys, we can find ways to improve how we collect feedback in the future. This leads to better decisions and smoother communication across the organization.
Sign In
- Log in to your Data Governance Tool account.

Open the Reports Module
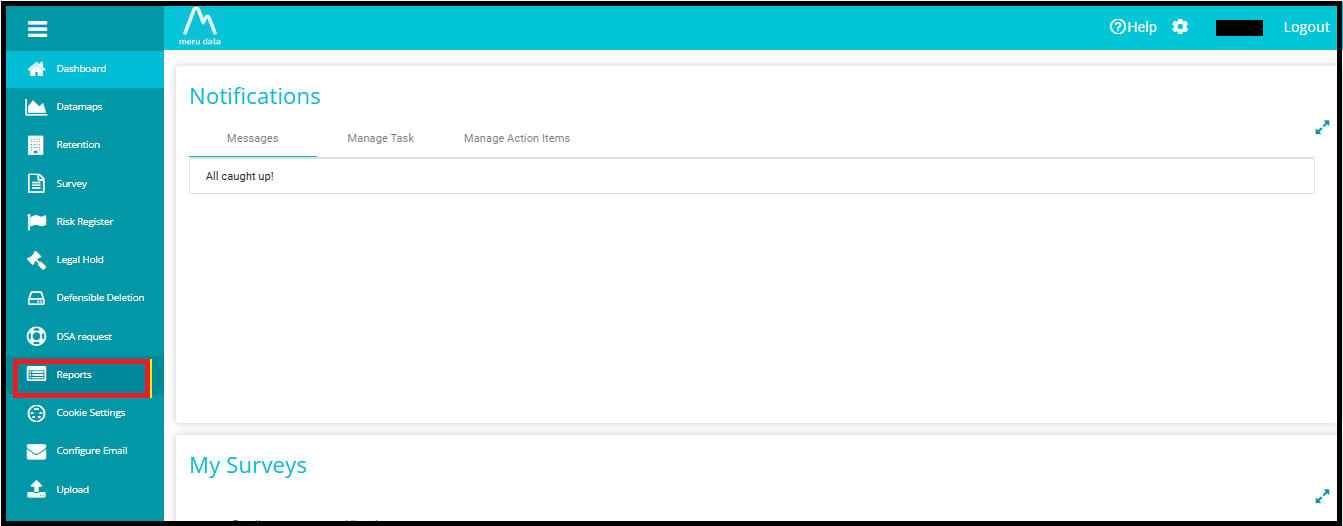
Click the hamburger menu
 to open the navigation panel.
Select Reports from the menu.
- Click the Manage Reports button on the Reports screen.
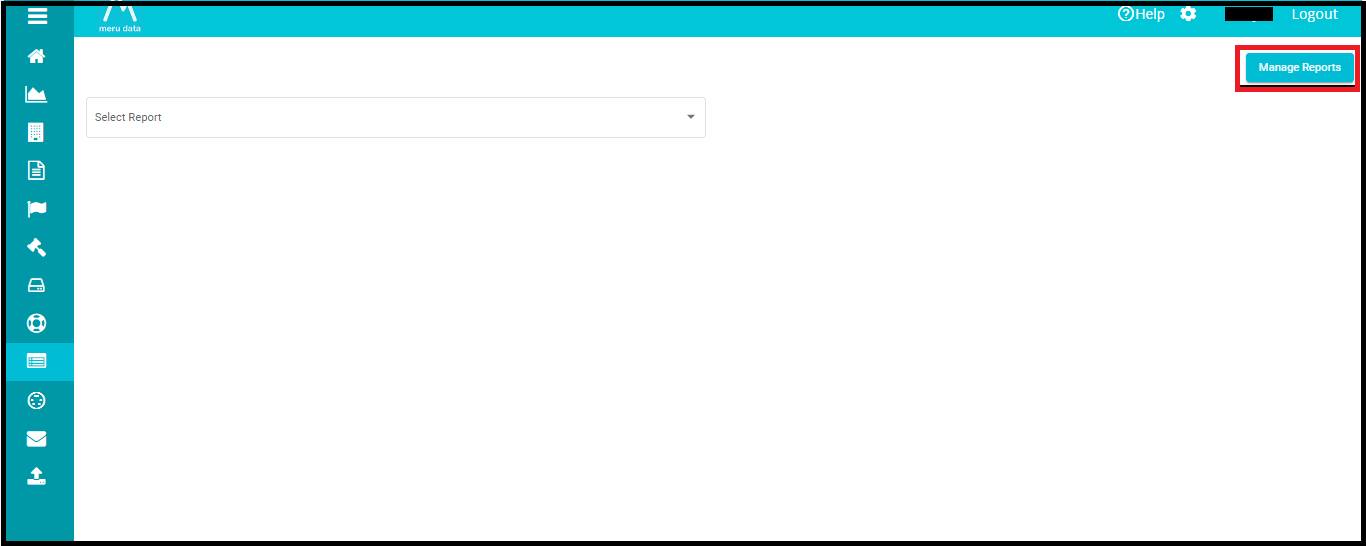
- You will be directed to the report management page.
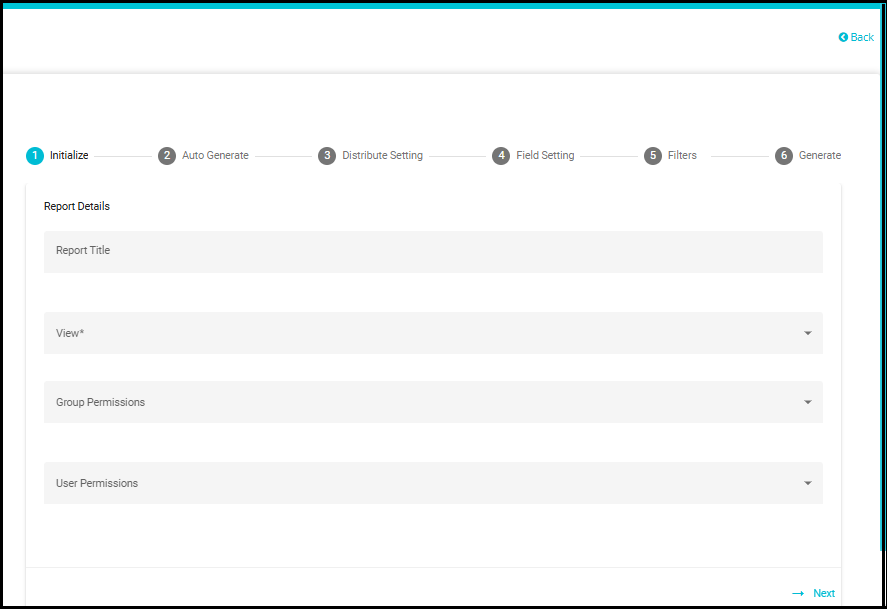
Initialize the Report
- Report Title: Enter a custom title.
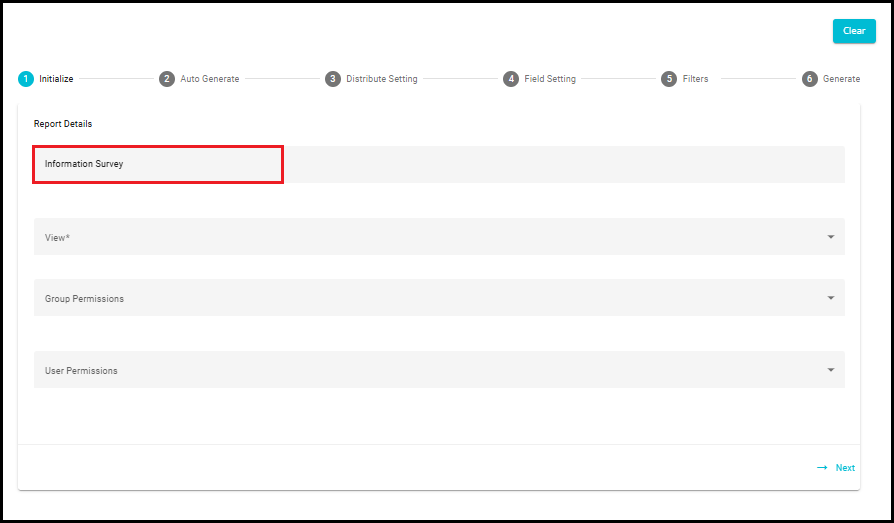
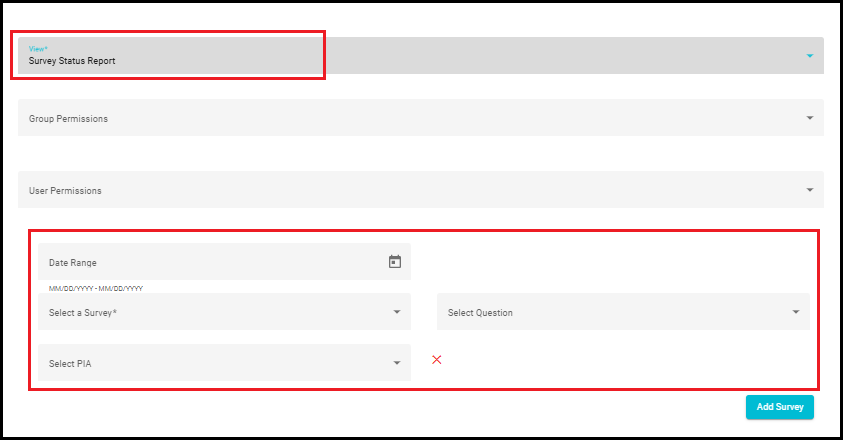
- View: Select "Survey Status Report" from the dropdown.
This selection will reveal four additional fields:
- Date Range, select a Survey, Select Question, and Select PIA.
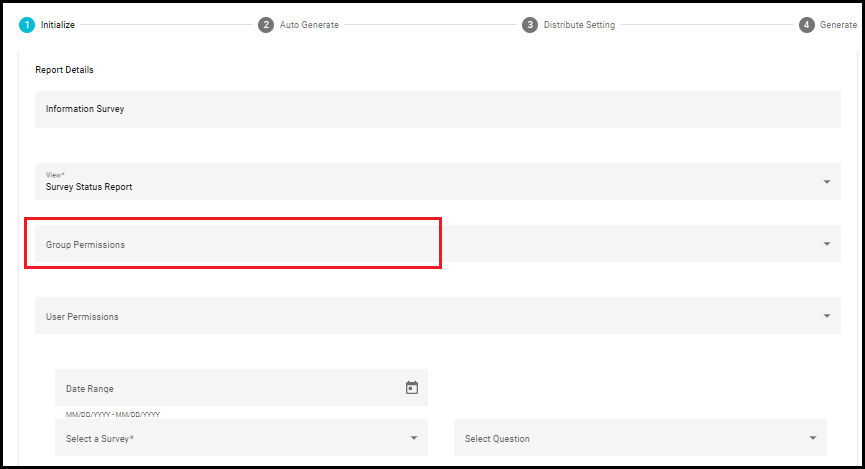
- Group Permissions: Select the groups that should have access to this report.
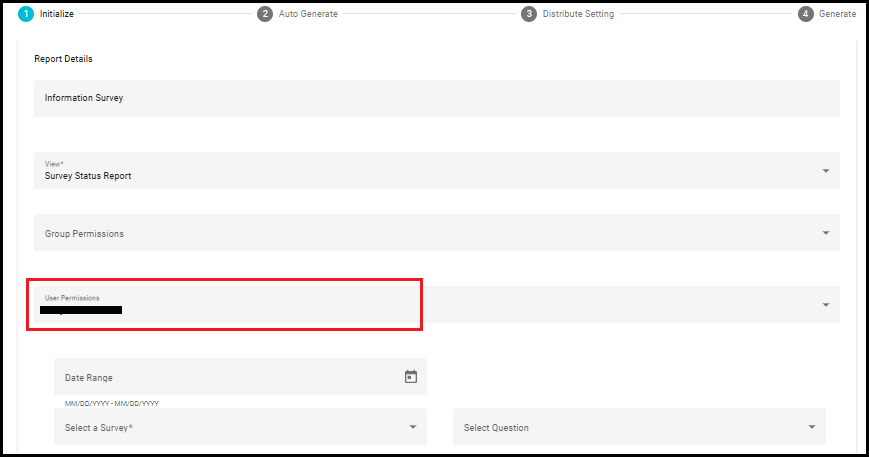
- User Permissions: If needed, restrict visibility to specific users by selecting them from the dropdown.
- Date Range Behavior:
If the start date and end date are selected the report will display data within the selected date range.
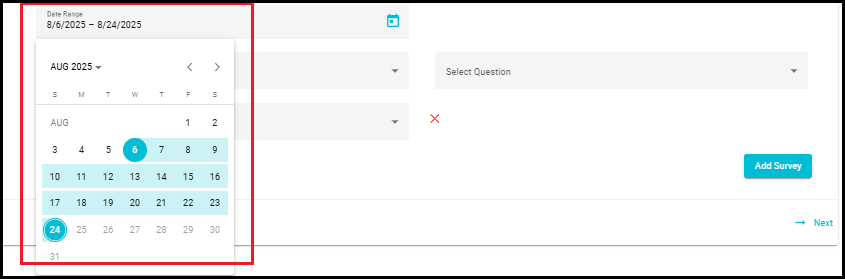
NOTE: If no date range is specified, the report will include all records from the beginning up to the current date.
Select a Question: This is important because it helps us understand how each department is participating in the survey. Without this mapping, we would only see overall numbers, but we wouldn't know which departments have responded and which haven't. By linking responses to departments, we can break down the data and see detailed insights at the department level.
Example:
HR: 15 responses out of 20
IT: 5 responses out of 25
Marketing: 10 responses out of 10
This tells you that the IT department has a low response rate and may need a reminder or support. Without mapping the department question, you wouldn't know this.
So, mapping a department-related question is key to tracking survey progress by department, helping you follow up where needed and ensuring complete and balanced feedback across the organization.
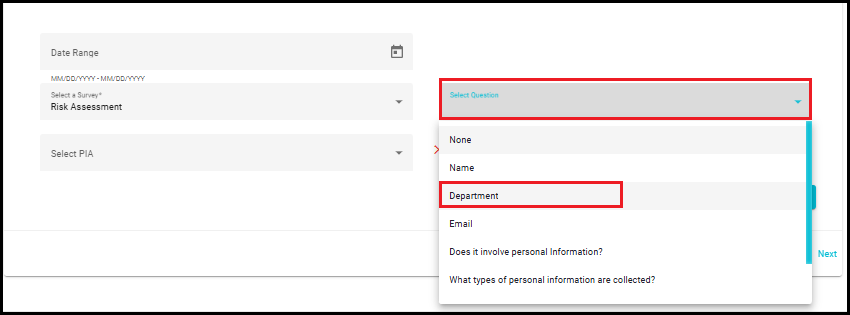
Note: It's not always the exact question labeled 'Department' that helps track survey progress by department. In some surveys, department-related insights can be derived from other questions - like team name, manager, location, or role.
Understanding PIA and Its Importance in Surveys
PIA (Privacy Impact Assessment) is a process used to evaluate how personal or sensitive information is collected, used, and protected in a survey or system. It helps organizations understand the privacy risks involved and take steps to reduce them. When a survey collects personal or sensitive data, it's important to assess the level of privacy risk. That's where PIA comes in.
In the context of surveys, PIA is used to classify the level of privacy risk based on the type of information being collected. This helps the organization ensure that proper privacy and security measures are in place.
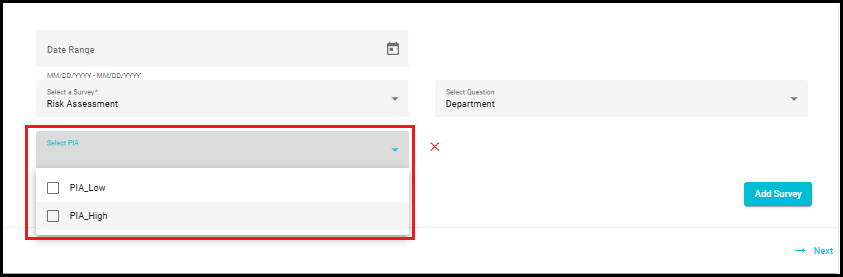
Select PIA
- In the Survey Status Report, there is a dropdown to select a PIA template. This dropdown will only show the PIAs that are specifically linked to the selected survey or assessment statement.
Example:
Let's say TechNova Solutions company runs three surveys:
Employee Health Survey -- collects medical data → marked as PIA_High
Workplace Feedback Survey -- collects general opinions → marked as PIA_Low
Event Registration Survey -- collects only names → marked as No_PIA
When generating the Survey Status Report, if you select PIA_High from the dropdown, only the Employee Health Survey data will be shown. This helps the privacy team focus on surveys with the highest risk.
In this example, PIA_High and PIA_Low are linked to TechNova Solutions assessments.
Therefore, only those PIAs will be visible in the dropdown when that particular survey is selected.
The dropdown does not show all available PIAs, but only those associated with the selected survey or assessment.
NOTE: If no specific PIA template is selected, it will include all data (PIA and No PIA).
If No PIA Is Associated with the Survey:
If no PIAs are attached to the selected survey or statement, the dropdown will appear empty.
No options like PIA_Low, PIA_High, or custom labels will appear.
This ensures the survey is treated as No_PIA, meaning it does not collect personal or sensitive data.
Survey Management for Combined Reports
This feature empowers users to create comprehensive reports by combining multiple surveys within a single reporting cycle. It's designed to offer flexibility while maintaining data integrity.
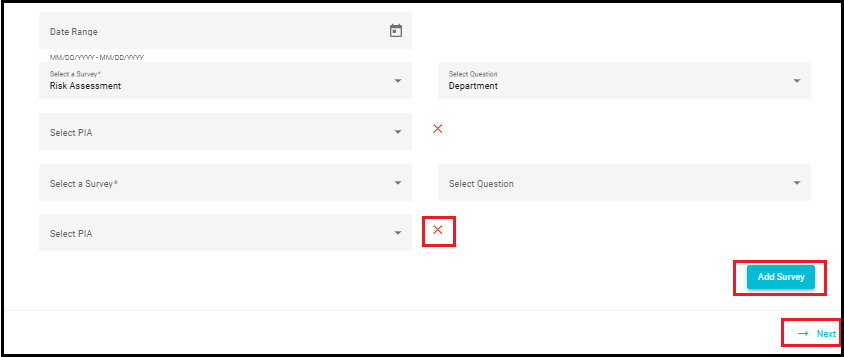
Add Survey:
Sometimes, a single assessment may be too large or detailed-for example, if a survey contains 150--200+ questions, it can be challenging to complete in one go.
To manage this, the assessment can be divided into multiple smaller assessments, each focusing on a portion of the original survey. Since all these segments are related to the same survey, the "Add Survey" functionality allows you to combine them into one unified report.
This helps provide a complete overview of the assessment results and ensures that all insights are captured effectively.
You can easily perform this action by clicking the "Add Survey" button.
Prevent Duplicate Entries:
- To ensure accuracy, the system does not allow the same survey to be added more than once. This prevents redundancy and keeps your data clean.
Remove Survey:
- If you need to exclude a survey from the combined report, simply click the red "X" icon next to the survey entry. This gives you full control over which data is included.
Auto Generate
The Auto-Generate Reports feature streamlines the reporting process by allowing users to schedule report generation at their preferred frequency-weekly, Biweekly, monthly, Quarterly, Half-yearly or yearly.
Report versions are automatically generated based on the defined frequency only when changes are detected in the report content. This includes any addition or removal of data.
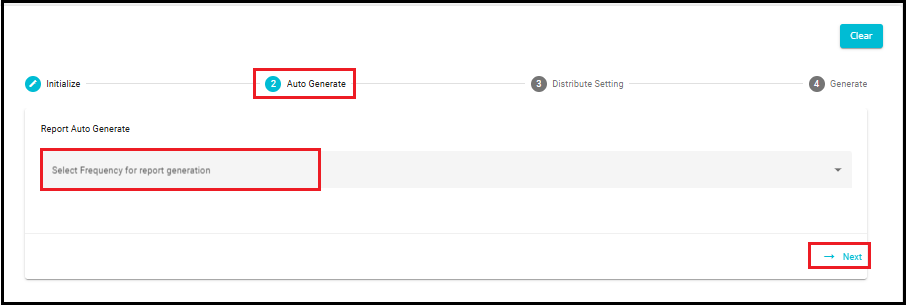
Click on the "Next" arrow located at the bottom right corner of the "Auto Generate" section.
This will take you from Step 2: Auto Generate to Step 3: Distribute Setting, where you can configure how and to whom the reports will be sent.
Distribute Settings
- Enable Distribution
When you select the Enable Distribution option you will receive an email notification with a direct link to access your report. This makes it easier to stay informed without having to manually search for the report in the system.
To view the report, you'll need to log in to your account. Once logged in, instead of navigating through menus or searching for your report in a dropdown list, you'll be automatically taken to your specific survey report. This saves time and ensures you're looking at the right data immediately.
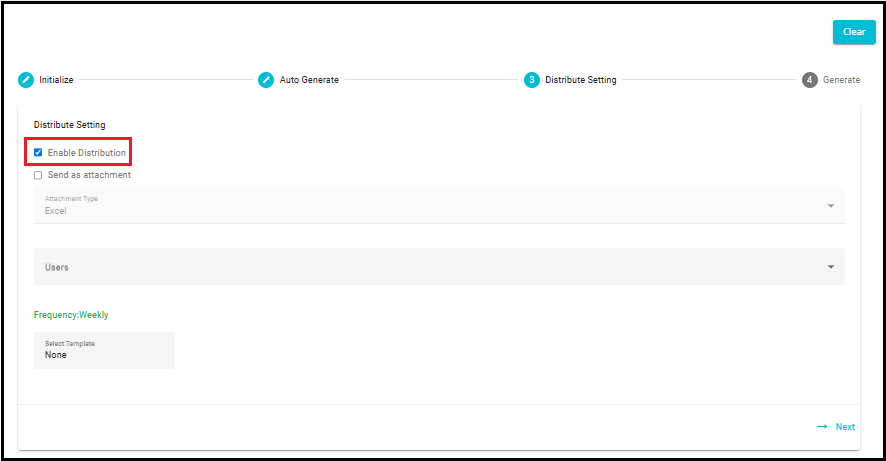
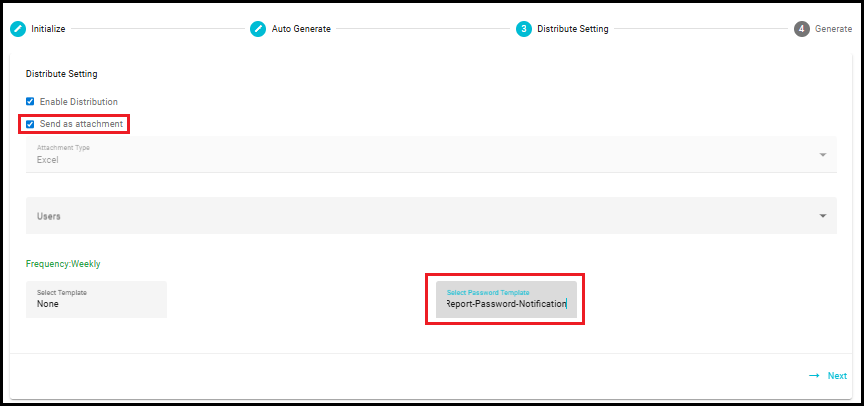
Send as Attachment
If you choose the Send as an Attachment option while setting up the report distribution, an additional field will appear called Select Password Template. This is because the report will be sent as an encrypted (password-protected) file via email to ensure data security.
Once this option is enabled:
- The report will be emailed as a secure attachment (usually in a ZIP format).
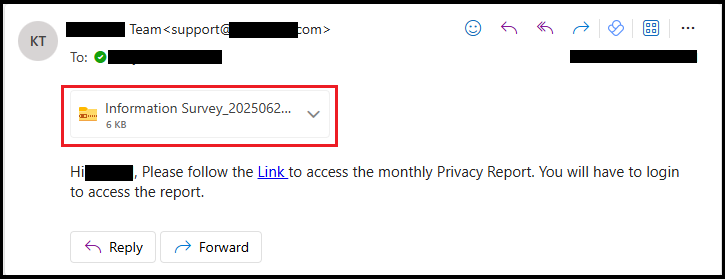
- To open the encrypted file, the recipient will need a password.
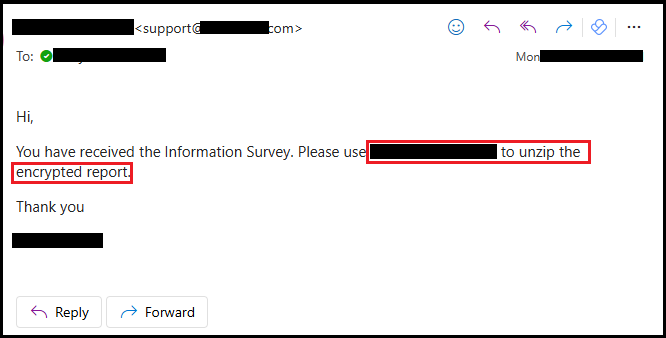
- The password will be sent to the recipient in a separate email, based on the selected password template.
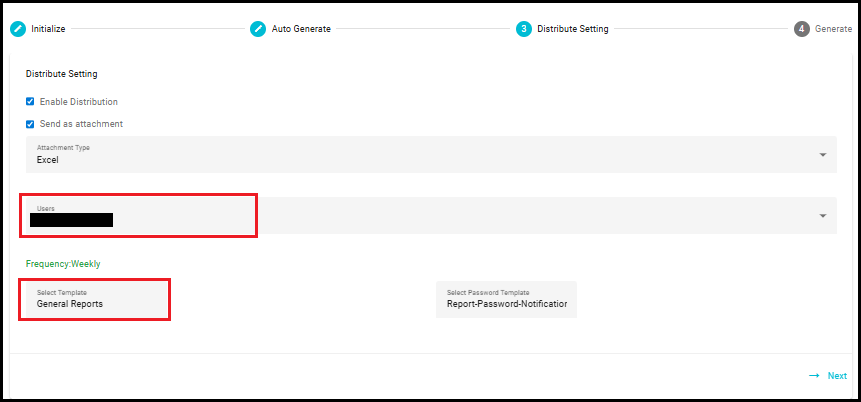
Select User
Use the user selection dropdown to choose recipients.
You can select one or multiple users based on your distribution needs.
Select Template
When you select a template from the dropdown, you choose the email format that will be used to send notifications.
These templates define how email looks and what content it includes. You can customize these templates through the Configure Email module.
If you do not select any template, the frequency field will not be displayed, meaning you won't be able to schedule how often the report is sent. However, once you select a template, the frequency option will appear.
Frequency
Allows you to choose how often the report should be distributed. The frequency of these email notifications is not limited to weekly.
It depends entirely on the frequency you select during setup.
You can choose to receive the report hourly, daily, weekly, Biweekly, monthly, Quarterly, Half-yearly or yearly.
You can modify the frequency of email notifications in the "Configure Email" module during the report setup process.
To learn more about setting up and managing email configurations, refer to the Configure Email module
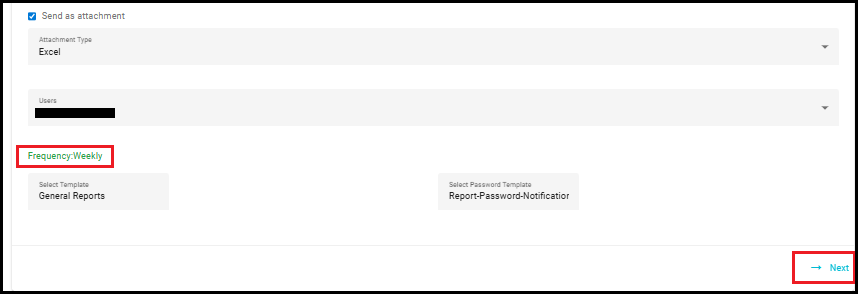
- Click the "Next" arrow located at the bottom right corner of the screen.
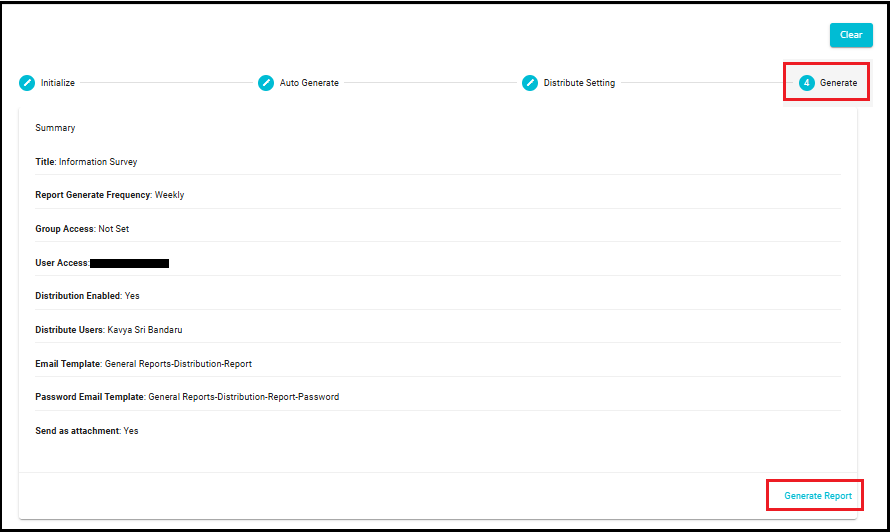
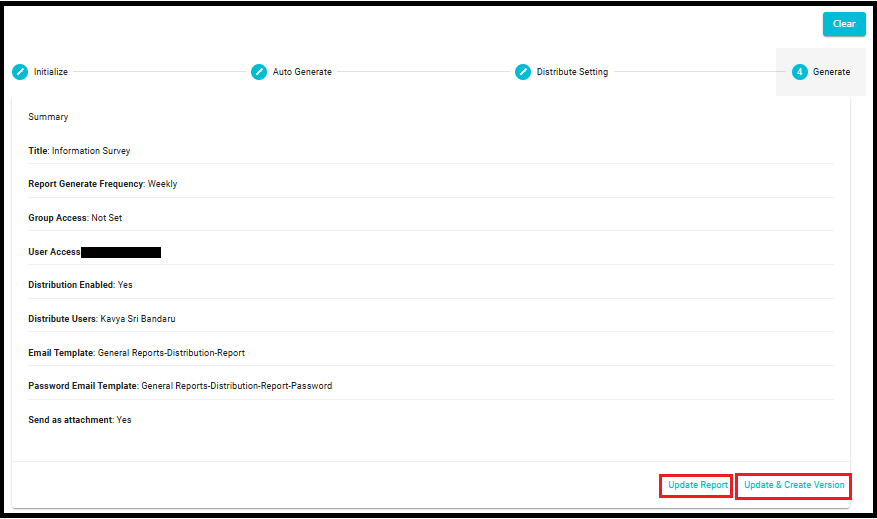
Review and Generate
Review the configuration summary in the Generate section.
Click Generate Report to save and distribute the report.
Update Existing Report: Make changes to a report without creating a new version-ideal for quick edits or corrections.
Update & Create New Versions: Save a modified report as a new version, preserving the original while capturing changes. Each version is time-stamped for easy reference.
- All saved versions are available in the Version dropdown within the report interface, allowing users to switch between versions as needed.
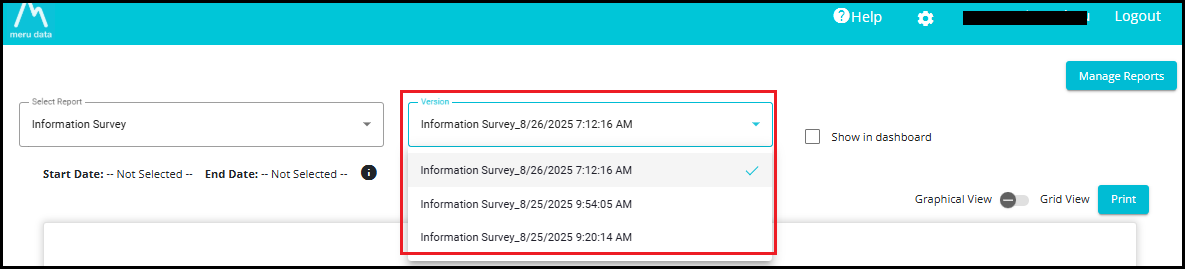
Viewing the Survey Status Report
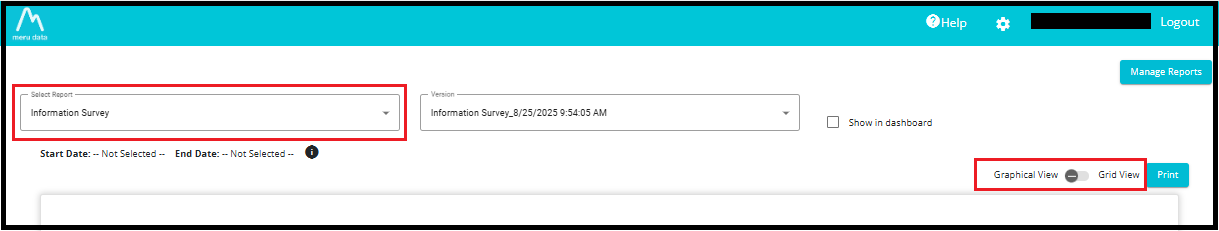
Access the Report
Go to Reports from the hamburger menu.
Select the report from the dropdown list.
The report opens in graphical view by default.
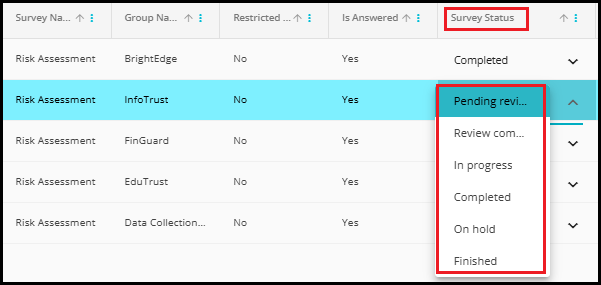
- Assessment Status Overview
It shows the overview of the pending & completed survey at the department level.
Pending (distributed but not answered)
Completed (answered and reviewed)
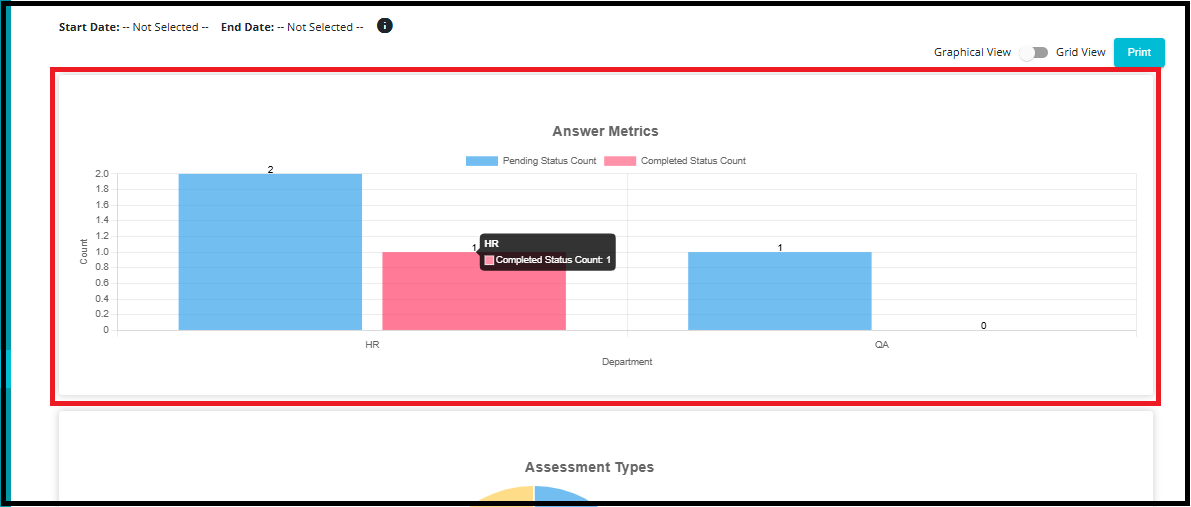
Note: Survey status values are customizable, you're not limited to just 'Pending' or 'Completed'. You can define statuses like on hold, Awaiting Response, Review Completed, Finished or any other label that fits your workflow. For guidance on setting up custom statuses, refer to the documentation: Custom Survey Status
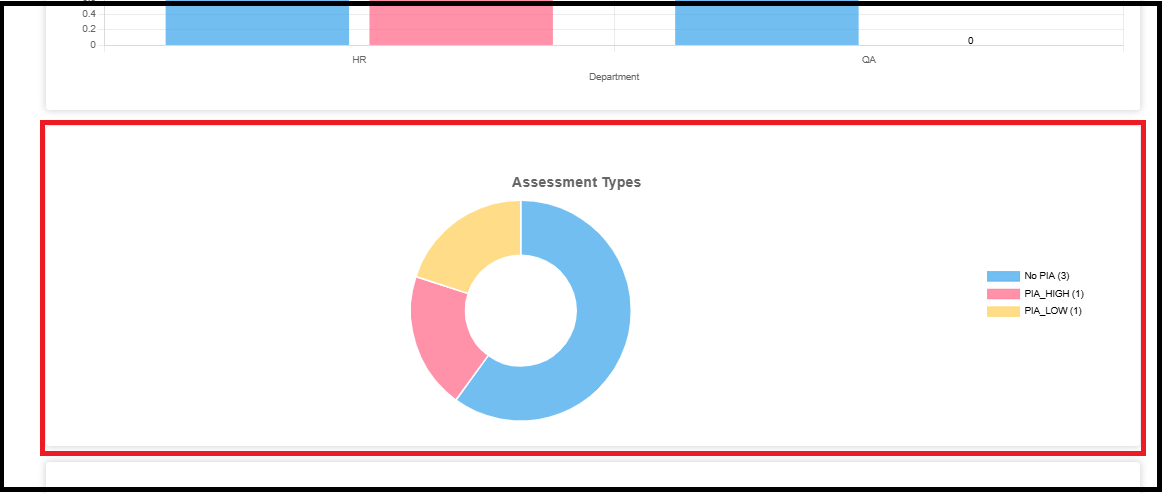
- Assessment Types
The Assessment Types Graph displays how many PIA templates were used across different assessments. It helps categorize assessments based on the level of privacy risk they carry. (HIGH_PIA, LOW_PIA or NO PIA)
It gives a quick overview of how many assessments fall under each privacy risk level.
It helps privacy teams prioritize their focus, for example, by paying more attention to high-risk assessments.
It supports compliance tracking, showing how many assessments required a PIA and what level of risk they carried.
It reflects the PIA categories selected in the "Select PIA" field while creating the report.
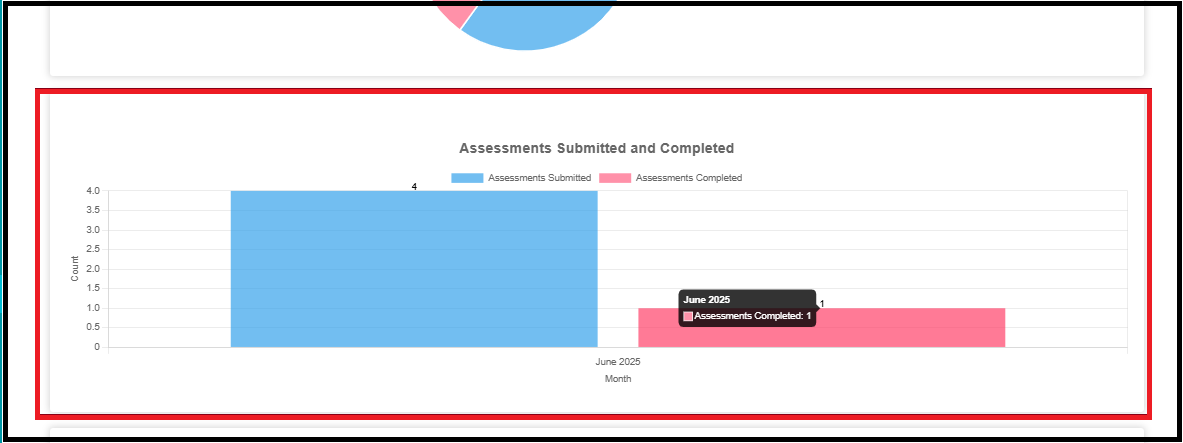
- Submission vs. Completion Trends
It helps identify where surveys are getting stuck---e.g., many submissions but few completions may indicate delays in review or approval.
It provides insight into monthly trends, showing whether survey processes are improving or slowing down.
It supports better resource planning, allowing teams to focus on clearing backlogs or improving completion rates.
A survey is considered Submitted when a user fills out the survey and clicks the submit button, sending their responses to the system. However, submission alone does not always mean the survey is fully complete, especially in workflows that involve multiple steps or approvals.
A survey is marked as Completed when all required steps in the survey workflow are finished. This may include:
Final approvals (e.g., manager or reviewer sign-off)
Required follow-up actions
Validation or review of submitted data
Only after these steps are taken, the survey is considered as fully completed.
- Average Completion Time
The Average Completion Time graph shows how long it takes on average to complete each type of assessment.
This helps organizations understand which assessments are taking longer and may need process improvements or additional support.
The average completion time is calculated by taking the total number of days it took to complete all assessments of a particular type and dividing it by the number of completed assessments of that type.
Example:
3 surveys are categorized as PIA_High.
2 surveys have been completed:
Survey 1: Completed in 1 day
Survey 2: Completed in 8 days
Survey 3 is not yet completed, so it is not included in the calculation.
Calculation:
Average Completion Time = (1+8)/2= 9/2 = 4.5 days
The average completion time for the completed PIA_High surveys is 4.5 days.
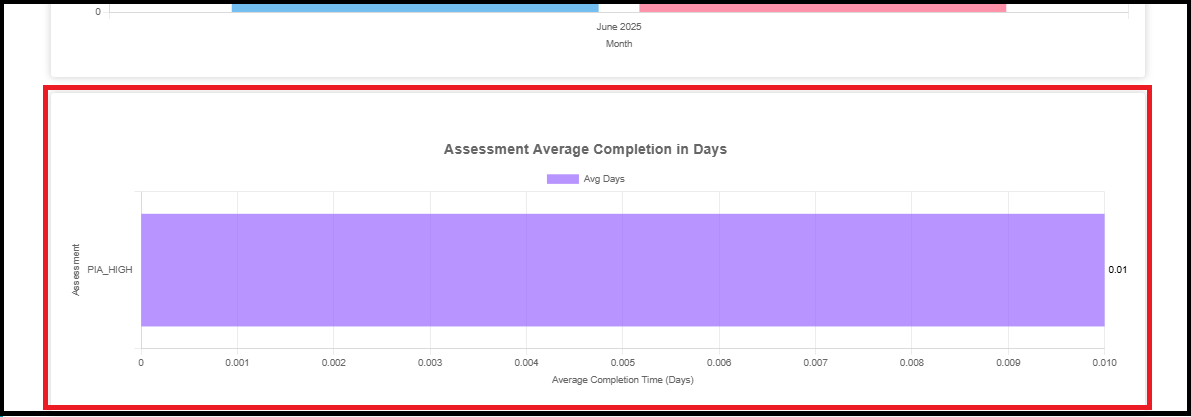
- The average shown is approximately 0.01 days, which is very fast, indicating that the one completed assessment was processed in 1 day.
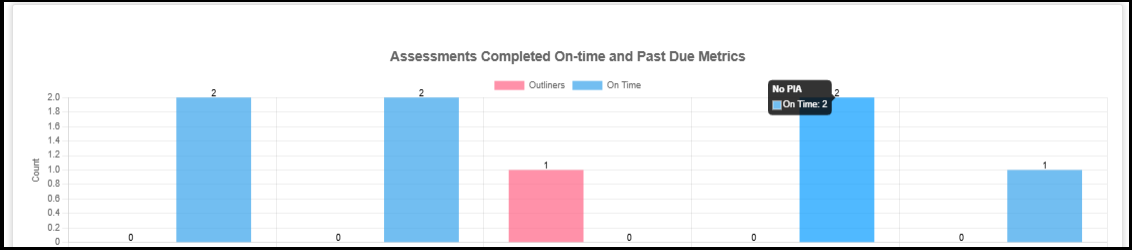
Assessments Completed On-time and Past Due Metrics
This feature ensures timely completion tracking of survey assessments by comparing actual completion dates with predefined due dates.
Due dates are configured in the Custom Survey Status settings. Each stage of the assessment process is assigned a specific due date.
The Survey Status Report component analyzes raw survey data to determine:
The actual completion date of each assessment.
The assigned due date is based on the assessment stage.
Whether the assessment was completed on time or overdue.
For each completed assessment:
The system compares the actual completion timestamp with the due date timestamp
The result is categorized as:
On Time: Completed on or before the due date.
Overdue: Completed after the due date.
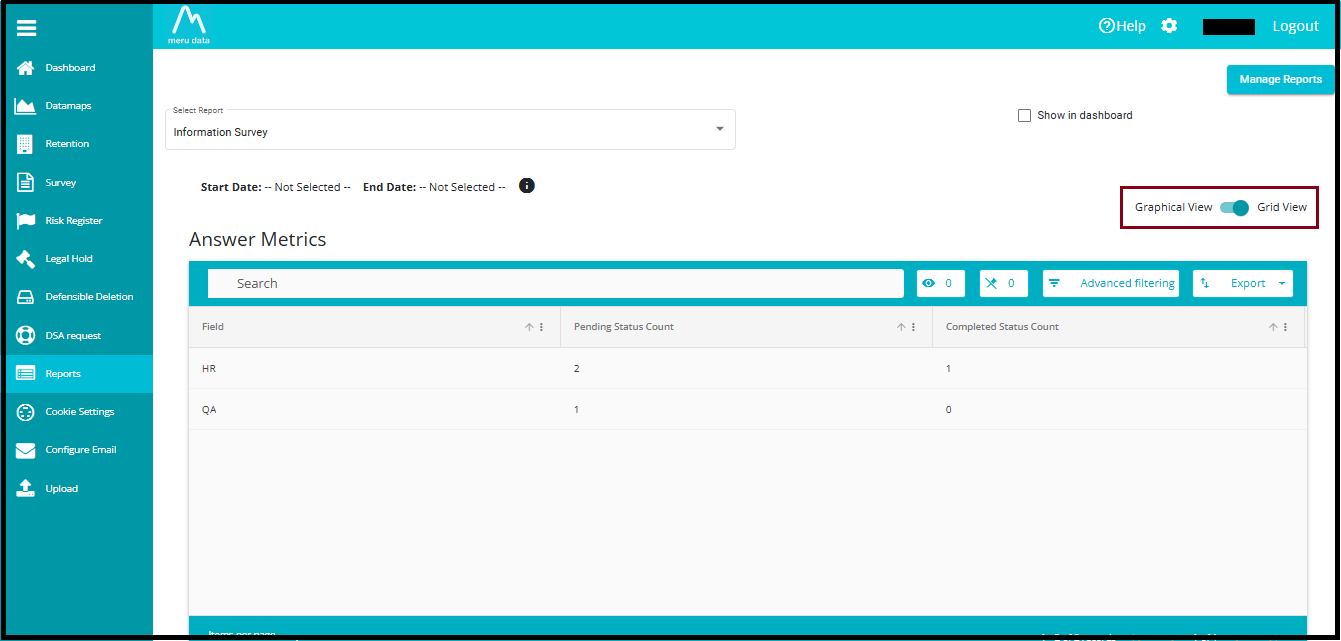
Switch to Grid View
- Toggle the Grid View switch to see the report in tabular format.
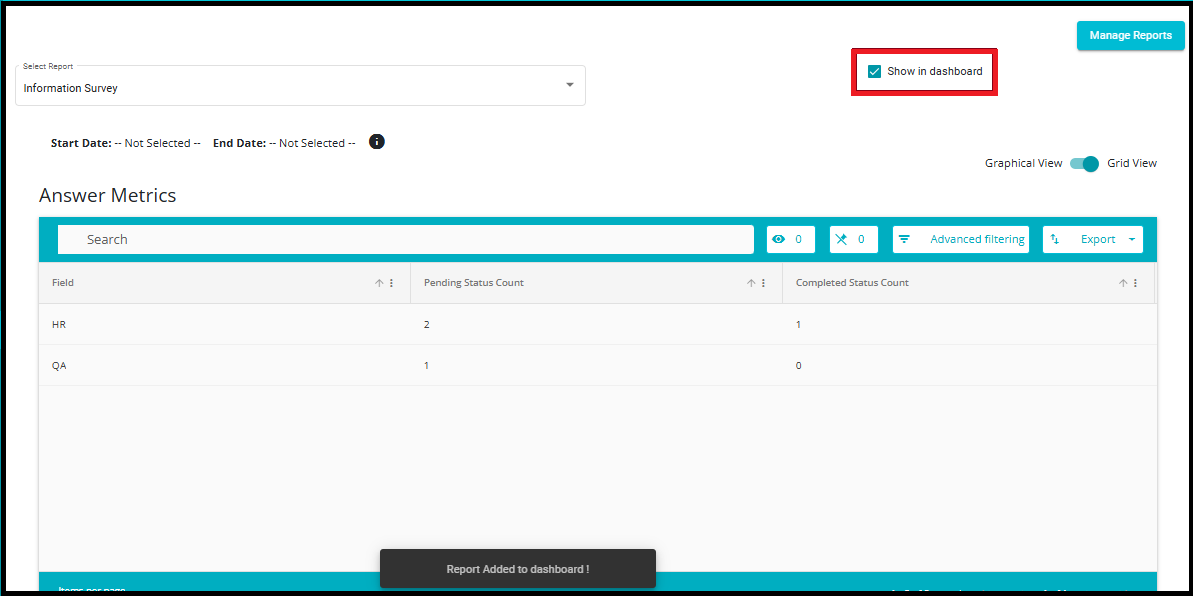
Show on Dashboard
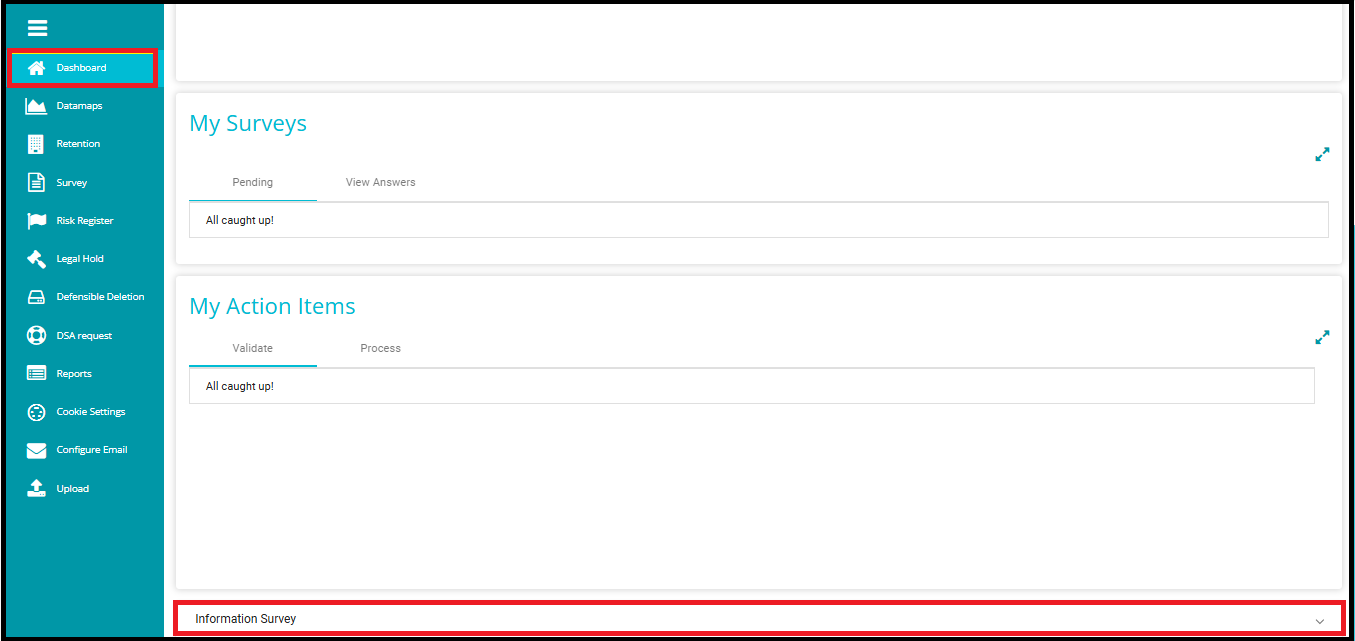
- Check "Show in Dashboard" to pin the report to the main dashboard.
- Click the report on the dashboard to view it directly.
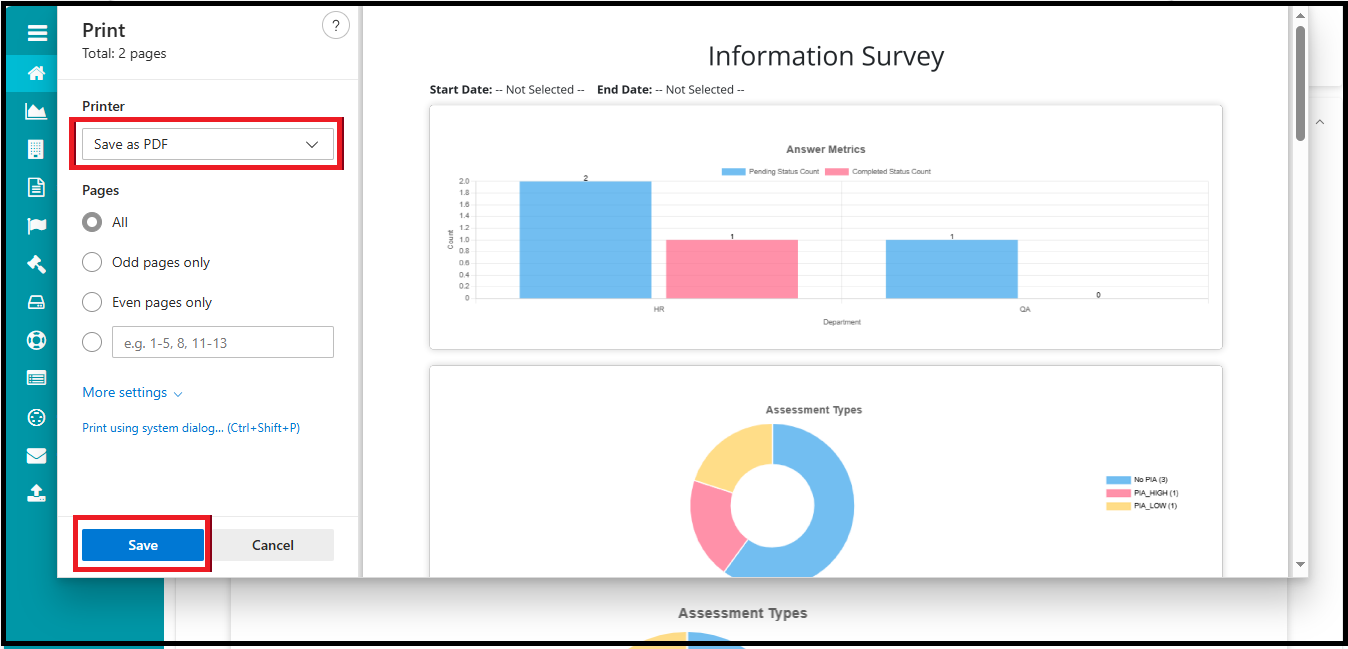
- Click on the Print button or icon in the report interface.
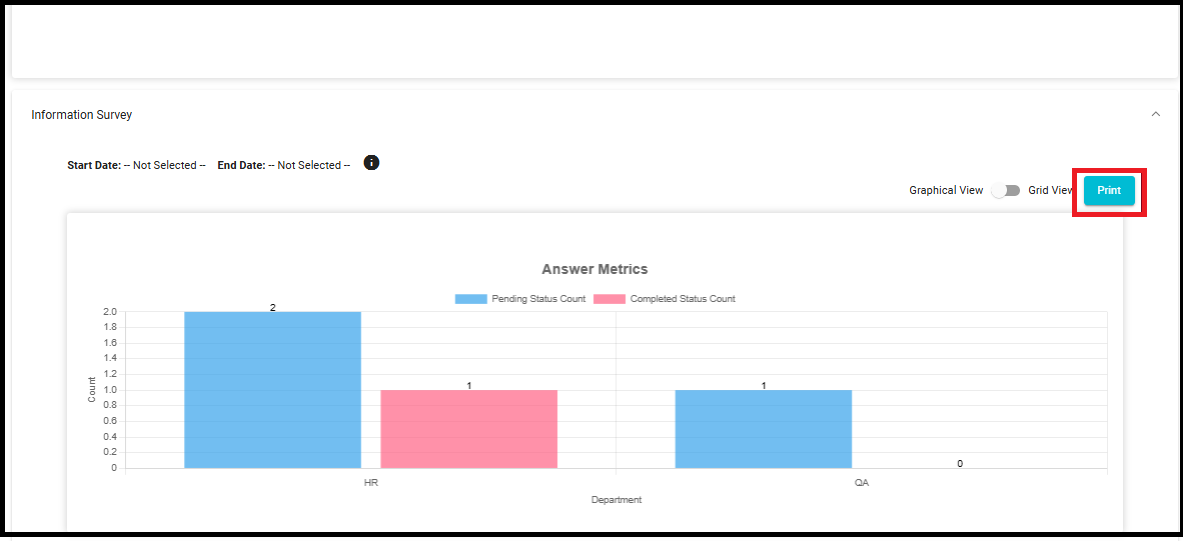
A Print dialog box will appear, allowing you to choose how you want to save the report.
You can save a report as PDF, One Note for windows 10, Fax, etc.